
This is a practical tour of Spring Boot multi-tenant architecture seen through a single screen: the admin console of a multi-tenant LMS, where every organisation’s data must stay strictly isolated while an admin still sees their whole organisation at once. It shows how tenant-scoped facts roll up into live reports without ever creating a second source of truth.
The admin console is where a multi-tenant LMS finally shows you the whole thing at once. The instructor authored courses in Part 12; the student learned and was graded in Part 13; Part 14 builds the admin console that rolls all of that up — catalogue oversight, organisation-wide reports, and a billing view — and in doing so completes the working-platform arc that turned this series’ reference backend into a system you can run, log into, and operate across three real roles.
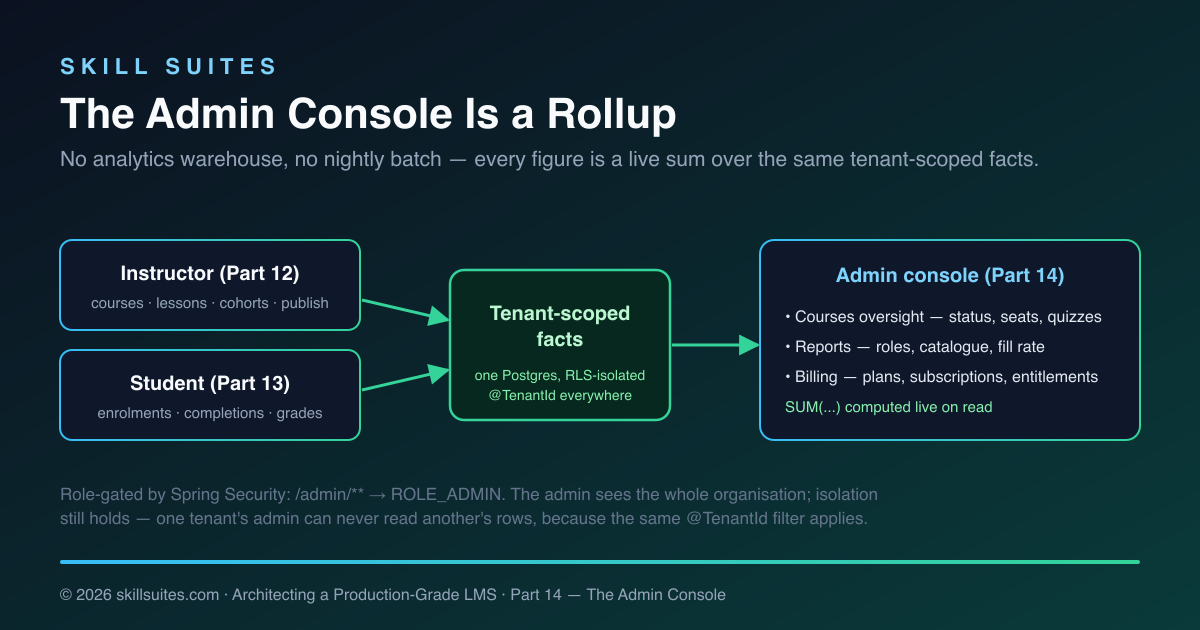
The central idea of this part is almost anticlimactic, and that’s the point: the admin console adds no new source of truth. Every number on it is a live sum over the same tenant-scoped facts the instructor and student workspaces already create. There’s no analytics warehouse, no nightly batch, no duplicated counters — just queries that fold the existing data into an organisation-level view. That’s what makes the admin console cheap to build and impossible to get out of sync, and it’s the lesson worth carrying to your own systems.
Where Part 14 sits: the arc, completed
Parts 1–10 built and productionised the backend. Parts 11–14 put a working, multi-role platform on top of it:

| Part | Role | What it delivered |
|---|---|---|
| 11 | All roles | Login, enforced RBAC, tenant-from-identity, role dashboards |
| 12 | Instructor | Author courses & lessons, draft→publish, cohort rosters |
| 13 | Student | Catalogue → enrol → player → auto-graded assessment → certificate |
| 14 | Admin | Catalogue oversight, organisation reports, billing & entitlements |
After this part the three workspaces close the loop: instructors produce content and classes, students consume them and generate progress and grades, and the admin sees the organisation-wide rollup of both — all on one Spring Boot deployable, all server-rendered with Thymeleaf, all isolated per tenant.
The thesis: the admin console is a rollup, not a store
It is tempting to build an admin dashboard the way many products do: a separate analytics database, an ETL job that copies operational data into it overnight, and a set of precomputed metrics the dashboard reads. For a platform at this stage, that would be exactly the wrong move — it adds a second source of truth that can disagree with the first, a batch that’s always a few hours stale, and a pile of infrastructure to operate.
Instead, every figure the admin console shows is computed on read, live, from the operational tables. “How many courses are published?” is a filter over the courses table. “What’s the seat fill rate?” is the sum of enrolled counts over the sum of capacities across cohorts. “How many lessons have been completed?” is a count of the idempotent completion facts from Part 13. The admin console is a projection of the same data the other roles write — viewed from the top, never copied.
This works because the platform is still a modular monolith over one database (the architecture from Part 1). The admin controller can ask the catalog, enrolment, learning, assessment, and billing services for their numbers and add them up in a single request, because they’re all one transaction away. When — and only when — an organisation grows to the point where live aggregation over millions of rows gets slow, you reach for the tools the series already built for exactly that: the event stream and read-model projections from Part 5. Until then, precomputing would be solving a problem you don’t have, at the cost of a consistency bug you’d have to chase. Build the rollup; add the warehouse the day the rollup is too slow, not before.
| Live rollup (what we build) | Precomputed analytics store | |
|---|---|---|
| Freshness | Always current — read on demand | Stale between batch runs |
| Consistency with operational data | Guaranteed — same rows | Can silently diverge |
| Infrastructure | None beyond the existing DB | ETL job + second datastore |
| Failure modes | A slow query (visible, fixable) | Drift, late batches, reconciliation jobs |
| Cost when small | Negligible | Pure overhead |
| Cost when very large | Slow aggregations — time to add read models | Designed for this scale |
The right-hand column isn’t wrong — it’s just premature. The engineering judgment Part 14 models is matching the solution to the actual problem size: a live rollup is correct until it measurably isn’t, and the migration path to the heavier approach (Part 5’s projections) is already in the codebase when that day comes. Reaching for the warehouse first is the kind of speculative complexity that looks like foresight and behaves like debt.
The dashboard: the console’s front door
An admin signing in lands on the dashboard — the at-a-glance summary that frames everything else. It shows the headline counts (how many admins, instructors, and students; how many courses) and the list of people in the organisation, so the first thing an administrator sees is the shape of their tenant. It’s the lightest of the console screens by design: a few numbers and a roster, enough to orient, with the deeper views one click away in the sidebar.
Like every other figure in the console, those headline counts are computed live — accounts.count(Role.LEARNER) for students, catalog.allCourses().size() for courses — so the dashboard is never stale relative to what’s actually in the system. The dashboard, the reports page, and the courses page are three zoom levels onto the same underlying data: the dashboard answers “what’s the rough shape of my org?”, reports answers “what are the exact totals and rates?”, and the courses page answers “which specific courses need attention?”. An administrator moves between them without ever leaving the single source of truth, because there’s only one.
The sidebar itself is the same role-aware shell fragment every page in the platform uses, rendered with the admin’s menu — Dashboard, People & Roles, Courses, Billing, Reports — and the active item highlighted. There’s no separate admin app, no different navigation system; it’s the same server-rendered shell from Part 11, parameterised by role. Consistency across the three workspaces isn’t an effort to maintain; it falls out of sharing one fragment and one stylesheet.
Catalogue oversight
The first admin screen is organisation-wide visibility into the catalogue: every course — published and draft, unlike the student’s catalogue — with the numbers that matter for oversight. The controller builds one row per course, gathering the counts from the contexts that own them:
@GetMapping("/admin/courses")
public String courses(@AuthenticationPrincipal UserPrincipal p, Model model) {
    principal(model, p);
    List<CourseRow> rows = new ArrayList<>();
    for (Course c : catalog.allCourses()) {
        List<Cohort> cohorts = enrollment.cohortsForCourse(c.id());
        int enrolled = cohorts.stream().mapToInt(Cohort::enrolledCount).sum();
        int capacity = cohorts.stream().mapToInt(Cohort::capacity).sum();
        rows.add(new CourseRow(c.title(), c.isPublished(), catalog.lessonCount(c.id()),
            cohorts.size(), enrolled, capacity, assessment.assessmentsForCourse(c.id()).size()));
    }
    model.addAttribute("courses", rows);
    return "admin/courses";
}
Each CourseRow carries the course’s title and status, its lesson count (from Catalog), its cohort count and total enrolled-versus-capacity (from Enrolment), and how many assessments it has (from Assessment). The admin sees, at a glance, which courses are still drafts, which are filling their seats, and which have no assessment yet — the operational health of the catalogue, assembled from four contexts the admin controller never reaches into beyond their public APIs.
Organisation reports
The reports page is the rollup in its purest form: organisation-wide totals across people, catalogue, enrolment, and engagement, every one of them a live aggregate. The controller computes them in a single pass:
List<Course> all = catalog.allCourses();
long published = all.stream().filter(Course::isPublished).count();
long lessons = all.stream().mapToLong(c -> catalog.lessonCount(c.id())).sum();

int cohorts = 0, capacity = 0, enrolled = 0;
for (Course c : all) {
    for (Cohort h : enrollment.cohortsForCourse(c.id())) {
        cohorts++;
        capacity += h.capacity();
        enrolled += h.enrolledCount();
    }
}

model.addAttribute("students", accounts.count(Role.LEARNER));
model.addAttribute("coursesPublished", published);
model.addAttribute("fillRate", capacity == 0 ? 0 : (int) Math.round(enrolled * 100.0 / capacity));
model.addAttribute("completions", learning.totalCompletions());
The result is a console of organisation metrics: how many admins, instructors, and students; how many courses are published versus draft and how many lessons and assessments they contain; how many cohorts exist, how many total seats, and what fraction are filled; and how many lessons learners have completed across the organisation. The role counts come from the account service, the catalogue figures from Catalog, the seat numbers from Enrolment, and the engagement number from the Learning context’s completion facts. None of it is stored as a metric anywhere — it’s all summed on the spot, so it’s never stale and never disagrees with the operational screens.
This is the same “store facts, derive numbers” discipline that ran through enrolment, grading, and the Part 13 progress model, now applied at the organisation level. The admin’s “lessons completed” is the same count of LessonCompletion rows the student’s progress bar reads — one fact, two views, guaranteed consistent because there’s only one underlying truth.
The war story: the stats table that lied
If you’ve operated an LMS — or any SaaS with a dashboard — you’ve probably met the bug this design avoids. Someone, reasonably, decides the admin dashboard shouldn’t run “expensive” counts on every page load, so they add an org_stats table: columns for total enrolments, total completions, active subscriptions, updated by triggers or a cron job. For a while it’s fast and fine. Then the numbers start to lie.
An enrolment is created through a path that forgot to bump the counter. A course is deleted but its lessons’ completions are still summed in. The nightly job fails one night and nobody notices for a week. A tenant is offboarded and the global totals never get decremented. None of these are dramatic — each is a small, plausible omission — but they accumulate into an admin dashboard that confidently shows wrong numbers, and now you’re writing reconciliation scripts to make the dashboard agree with reality, which is the exact work you were trying to avoid by precomputing. The dashboard that was supposed to build trust quietly erodes it.
Deriving on read sidesteps the whole class of bug. There is no counter to forget to bump, no batch to fail, no decrement to miss. “Active subscriptions” is count(subscriptions where status != CANCELED) at the instant you ask; if a subscription was canceled a second ago, the next page load reflects it. The number can’t drift because it isn’t stored — it’s recomputed from the source every time. You trade a little query cost for the guarantee that the admin is never shown a figure that disagrees with the operational truth, and at the scale this platform targets, that trade is overwhelmingly correct.
How the rollup composes — and stays fast enough
The reports request touches five contexts, and it’s worth being clear-eyed about its cost. It lists the tenant’s courses once, then for each course asks Catalog for a lesson count, Assessment for an assessment count, and Enrolment for its cohorts. That’s a handful of queries per course — fine for the tens-to-hundreds of courses a real organisation has, and every one of them is tenant-scoped and index-backed (the tenant_id indexes that have shipped in every migration since Part 2, plus the per-course indexes added for lessons and completions). The whole page is a few milliseconds of database work on a realistic dataset.
The honest engineering note is the loop’s shape: it’s O(courses) queries, which is exactly the kind of pattern that becomes an N+1 problem at large scale. At this stage that’s the correct trade — the code is obvious, the data is small, and clarity beats premature optimisation. The moment a tenant’s catalogue is large enough for it to matter, the fix is mechanical and local: replace the per-course counts with a single grouped aggregate query (SELECT course_id, count(*) … GROUP BY course_id), or, at genuinely large scale, read from the projections fed by the Part 5 event stream. The admin screen doesn’t change; only the query behind it does. Naming that ceiling out loud — rather than pretending the simple version scales forever — is part of building something real.
The billing console
The third screen surfaces the billing engine built in Part 7. Payment processing is off in this demo — there’s no live PSP — but the engine is real: the subscription state machine, the entitlements, and the idempotent webhook handling all exist, and the admin console gives them a face. It shows the plans the organisation offers, the subscriptions and their statuses, and how many entitlements are currently active.
Building the subscription table requires the same cross-context, by-id join the instructor’s roster used: a Subscription knows a learnerId and a planId, but not the learner’s name or the plan’s name. The admin controller resolves them explicitly:
for (Subscription s : billing.allSubscriptions()) {
    String learner = identity.findUser(s.learnerId()).map(u -> u.name()).orElse("—");
    String plan = billing.findPlan(s.planId()).map(Plan::name).orElse("—");
    subs.add(new SubRow(learner, plan, s.status().name()));
}
Billing is tenant-scoped like everything else — Plan, Subscription, and Entitlement all carry @TenantId — so billing.allSubscriptions() returns this organisation’s subscriptions and no other’s, without the controller passing a tenant id. The page renders each status with its own badge, and each status carries operational meaning the admin needs to read at a glance:
| Status | Access | What the admin should know |
|---|---|---|
TRIALING |
Granted | In a free trial; no payment taken yet |
ACTIVE |
Granted | Paid and current |
PAST_DUE |
Granted (grace) | A payment failed; access continues during the dunning window while retries run |
CANCELED |
Revoked | Ended by the customer or by exhausted dunning; terminal |
That PAST_DUE-still-has-access nuance is exactly the kind of rule the Part 7 state machine encodes once and the admin console simply displays — the access decision lives in the Subscription aggregate’s grantsAccess(), not scattered across the UI. The console is a read-only window onto that machine; in a production build it’s where you’d add dunning alerts, a “reconcile now” action against the live processor, and revenue summaries. The entitlements count beside the subscriptions is the other half of the Part 7 design: entitlements are the small, hot access records read on every protected request, flipped by billing events, and the admin sees how many are currently active — the real measure of who can actually get in right now.
People & roles
The admin console also owns user management, the one place where new instructors and students enter the system. That screen arrived back in Part 11 — the admin lists everyone in the tenant and creates accounts, choosing each new account’s role — and it’s worth revisiting here as part of the complete console, because it closes the loop on how the other two workspaces get populated in the first place.
Creating an account is a single guarded operation: the admin submits a name, email, and role, and the account service creates the domain user, the per-tenant membership that carries the role, and the login credential together. The role chosen here is the same role that, at login, becomes the Spring Security authority gating /admin/**, /instructor/**, or /learn/** — so “make this person an instructor” on the people screen is exactly what lets them reach the instructor workspace from Part 12. The admin doesn’t assign permissions or wire routes; they pick a role, and the RBAC built in Part 11 does the rest. It’s the cleanest illustration of why role-based access control, rather than per-user permissions, is the right model for a platform like this: the admin reasons about people in terms of three roles, and the system translates that into enforced authority everywhere.
This is also where a production build would deepen the console most: editing a user’s role, deactivating an account that should lose access immediately, bulk-inviting a cohort of students, and an audit log of who changed what. Each of those is additive on top of the existing account service and the membership model — none of it disturbs the role gating or the tenant isolation that already work.
RBAC holds: the admin sees the org, not the world
One subtlety is worth stating plainly, because it’s the property that makes a multi-tenant admin console safe. The admin sees everything in their organisation — but still nothing outside it. The /admin/** routes are gated to ROLE_ADMIN by Spring Security, so an instructor or student can’t reach them at all. And within those routes, the same @TenantId filter and Row-Level Security that protect every other query still apply, driven by the tenant pinned from the admin’s own login. So Acme University’s admin sees all of Acme’s courses, cohorts, learners, and subscriptions, and is structurally incapable of seeing Globex University’s — the admin role widens what you can see within a tenant, never across tenants.
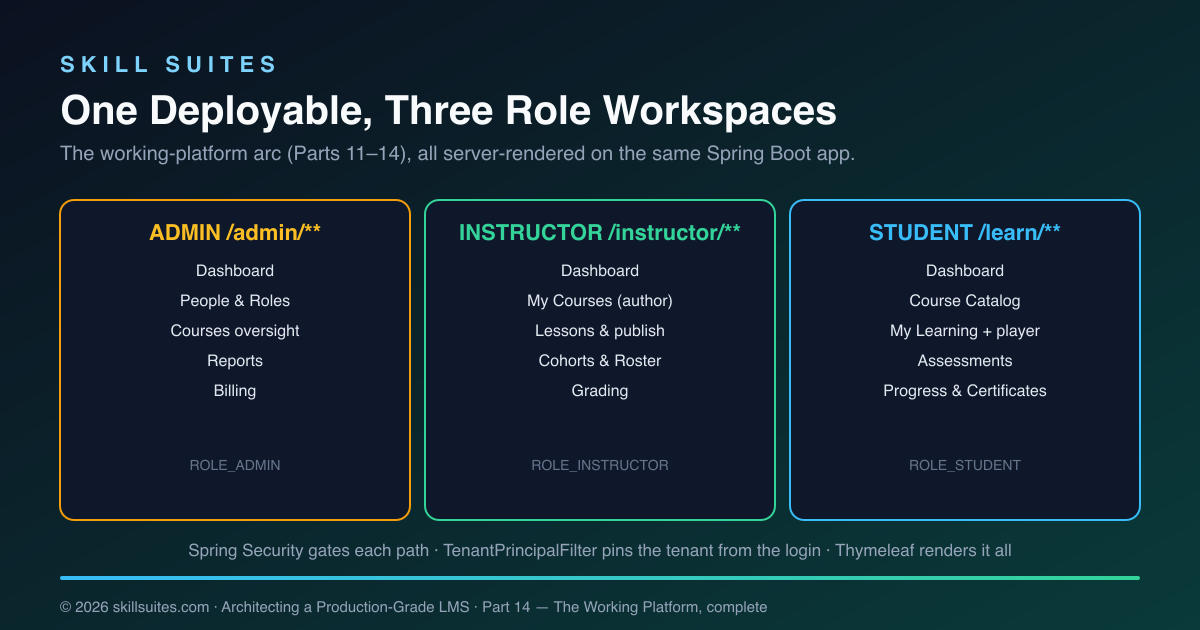
That diagram is the working-platform arc in one picture: three role workspaces, each a set of routes gated to a role, all on one Spring Boot app, all isolated per tenant by the same machinery. Add a route, and it inherits authentication, authorisation, and tenant isolation for free — which is why Parts 12, 13, and 14 each added a whole workspace with surprisingly little new code.
One schema, three views
The reason the admin console can be a pure rollup is that all three roles read and write the same tables. There is no per-role database, no admin-only mirror of the data. A course row is written by an instructor (Part 12), read by a student in the catalogue (Part 13), and counted by an admin in reports (Part 14) — one row, three perspectives. An enrolment is created from the student’s catalogue, appears in the instructor’s roster, and is summed into the admin’s fill rate. A LessonCompletion is written when a student ticks a lesson, drives that student’s progress bar, and rolls into the admin’s engagement total.
This shared-schema design is what a modular monolith buys you, and it’s why the roles compose into a coherent platform rather than three apps that happen to share a login. Each context owns its tables and exposes a public service API; the controllers for each role assemble those APIs into a role-appropriate view. The boundaries are real — enforced by the ArchUnit test, kept clean by referencing across contexts only by id — but the data underneath is unified. Contrast that with a microservice-per-role split, where the admin’s “total enrolments” would be a network call (or a cached copy) of the enrolment service’s count, with all the staleness and failure modes that implies. At this stage, one schema with hard module boundaries gives you the consistency of a monolith and most of the modularity of services, and the admin console is the clearest demonstration of why that’s a good trade.
What you can now do, end to end
With Part 14 in place, the platform supports a complete lifecycle on a single running instance:
- An admin signs in, sees the organisation’s health on the dashboard and reports, manages people, and reviews billing.
- An instructor authors a course, adds lessons, publishes it, and watches a cohort’s roster fill.
- A student finds that course in the catalogue, enrols, works through the lessons, takes the auto-graded assessment, and earns a completion certificate.
- The admin then sees every one of those actions reflected — one more published course, one more enrolment, one more completion, one more active subscription — because the console is a live rollup of exactly those facts.
It is, deliberately, a working first version rather than a finished commercial product — but it’s a real one: you can run it, log in as any role, and use it.
Code → file map
| Concern | File |
|---|---|
| Catalogue oversight, reports, billing routes | web/ui/AdminController.java |
| Billing read views (plans, subscriptions, entitlement count) | billing/BillingService.java |
| Org-wide completion total | learning/LearningService.java |
| Templates: courses, reports, billing | templates/admin/{courses,reports,billing}.html |
| Seeded plans & subscriptions for the demo | config/DataSeeder.java |
Role gating of /admin/** (from Part 11) |
auth/SecurityConfig.java |
Run it yourself
git clone https://github.com/muasif80/tutorial-lms-platform.git
cd tutorial-lms-platform
git checkout part-14
docker compose up -d --build
open http://localhost:8080/login   # sign in as [email protected] / scholr
As the admin, open Reports for the organisation rollup, Courses for catalogue oversight, and Billing for the seeded plans and subscriptions. Then sign in as [email protected] and publish a new course, or as [email protected] and complete some lessons — return to the admin reports and watch the numbers move, because they’re computed live from what you just did.
How we know it works
As with every part, Part 14 is gated by a green mvn verify in CI. The admin controller composes five contexts strictly through their public service APIs, and the ArchUnit modularity test — running on every build — confirms it never reaches into another context’s internals and introduces no dependency cycle. The billing read methods and the org-wide completion count are exercised through the same tenant-scoped path the UI uses, and tenant isolation, idempotent enrolment, and deterministic grading remain proven by the suites from Parts 2, 4, and 13. And the console is verified the way an administrator would: deployed live, signed in as the seeded admin, every figure cross-checked against the instructor and student screens that produced it.
The full picture: fourteen parts
Part 14 is the end of the road, so it’s worth standing back and naming what the whole series built. It started as an empty repository and a design brief, and it ends as a running, multi-tenant, multi-role learning platform — every part adding one production-grade capability and proving it with tests before moving on.
The first ten parts built the backend that everything else stands on: the product domain and modular-monolith architecture (Part 1); a multi-tenant data model with @TenantId and Row-Level Security, plus idempotent enrolment (Part 2); a video pipeline with direct-to-storage upload and signed CDN playback (Part 3); a deterministic auto-grading engine and a real-time fan-out tier (Part 4); a transactional outbox and idempotent event consumers (Part 5); hybrid search and recommendations (Part 6); a subscription billing engine with idempotent webhooks (Part 7); interoperability via LTI, SCORM, and xAPI (Part 8); the offline-sync engine behind an accessible, internationalised experience layer (Part 9); and the production concerns — observability, a one-command deploy, a hardened container — that make it shippable (Part 10).
The final four parts turned that backend into something a person can actually use. Part 11 added real login, enforced RBAC, and tenant-from-identity with role dashboards. Part 12 gave instructors a workspace to author and publish courses and see their rosters. Part 13 gave students the full learning flow — catalogue, enrolment, a lesson player, auto-graded assessments, and certificates. And Part 14 gives admins the console that rolls it all up. Each of those workspaces was small to build precisely because the ten parts beneath it were not skipped: authentication, isolation, idempotency, guarded state machines, and clean boundaries were already there to inherit.
That’s the through-line of the entire series, and the reason it’s worth studying as architecture rather than as a feature list: the boring, load-bearing decisions made early are what make the visible features cheap and correct later. A working LMS is the demonstration; the transferable lesson is the order of operations.
Where to take it next
This is the end of the working-platform arc, and it’s honest about being a foundation rather than a finished product. The natural next steps all build on the seams these four parts established, without disturbing them:
- Richer reports — time-series charts, per-course completion funnels, and cohort comparisons. When live aggregation gets slow, back them with the event-driven read models from Part 5 rather than querying operational tables directly.
- Real payments — wire a live PSP into the
PaymentGatewayport from Part 7; the state machine, entitlements, and idempotent webhook handling are already built and tested. - Deeper user management — role changes, deactivation, bulk invites, and audit logging on top of the existing people screen.
- A richer experience layer — the accessibility, i18n, and offline architecture from Part 9 describe how a production frontend would extend the server-rendered baseline these parts ship.
None of these require rearchitecting. That’s the dividend of the whole series: a modular monolith with hard tenant isolation, idempotent operations, guarded state machines, and clean context boundaries is a platform you extend, not one you fight.
Key takeaways
- An admin console is a rollup, not a store. Compute organisation metrics live from operational facts; don’t precompute into a second source of truth until live aggregation actually gets slow.
- The same data, viewed from the top. The admin’s “lessons completed” is the same count of completion facts the student’s progress bar reads — one truth, many views, never out of sync.
- Cross-context by id, everywhere. The billing table joins subscriptions to learner and plan names by id, the same discipline as the instructor roster — contexts stay independent.
- RBAC widens within a tenant, never across. The admin sees the whole organisation but still nothing outside it, because
@TenantIdand RLS apply to admin queries too. - New workspaces are cheap on a solid base. Each of Parts 12–14 added a full role workspace with little new code, because authentication, authorisation, tenant isolation, and rendering were already load-bearing.
Frequently asked questions
Why compute admin metrics live instead of using a separate analytics database?
Because at this scale a separate store buys you a second source of truth that can disagree with the first, plus a batch job that’s always a little stale and more infrastructure to operate. The platform is a modular monolith over one database, so the admin controller can sum the operational tables in a single request — always current, never inconsistent. The right time to add read-model projections (the event-driven approach from Part 5) is when live aggregation over large volumes actually becomes slow, not before.
Does the admin’s broad visibility weaken multi-tenant isolation?
No. The admin sees everything within their own organisation but nothing outside it. The /admin/** routes are gated to ROLE_ADMIN, and within them the same Hibernate @TenantId filter and PostgreSQL Row-Level Security apply, driven by the tenant pinned from the admin’s login. So an admin’s reports and billing views are automatically scoped to their tenant; cross-tenant access is structurally impossible, not merely unenforced.
Is billing functional if payment processing is off?
The billing engine is fully functional — the subscription state machine, entitlements, and idempotent webhook handling from Part 7 are real and tested. What’s off in the demo is the connection to a live payment processor. Subscriptions are recorded through the billing service’s entry point, and the admin console reads them; wiring a real PSP means implementing the existing PaymentGateway port, with no change to the state machine or the console.
How does the admin console show learner and plan names if subscriptions only store ids?
By the same by-id, cross-context join used throughout the series: a subscription carries a learnerId and a planId, and the admin controller looks the name up explicitly via the Identity and Billing services. The contexts never hold direct associations to each other’s entities, which keeps their boundaries hard and their isolation rules independent — the controller owns the join.
What does “the working-platform arc is complete” actually mean?
It means Parts 11–14 deliver a runnable, multi-role LMS on top of the reference backend: real login and RBAC, an instructor workspace that authors and publishes content, a student flow that enrols, learns, and is graded, and an admin console that rolls it all up — all tenant-isolated on one deployable. It’s a genuine working first version you can operate, not a finished commercial product; the article’s “where to take it next” section lists the production-hardening steps that remain.
Could the same admin patterns scale to a very large organisation?
The patterns scale; the implementation has a known limit. Live aggregation over operational tables is ideal up to a point, and the indexes and tenant scoping keep it fast for typical organisations. Past that, you keep the exact same admin screens but change where their numbers come from — pointing them at the rebuildable read models fed by the Part 5 event stream. The console’s shape doesn’t change; only its data source does, which is precisely why building the rollup first is the right call.
Next: the series continues with Part 15 — Rich Lesson Authoring, a genuine block editor (Editor.js) that lets instructors build full lessons from sections of text, images, video, tables, code and embeds, rendered to a safe, no-JavaScript student view.
