
In Part 1 we gave our RFP engine a real backend — a FastAPI service with REST, a live WebSocket, durable human-in-the-loop, and SQLite history. Now we build the part people actually see: a React dashboard so clear and alive that a procurement lead can’t look away. Fit-score gauges, a requirement-coverage radar, a recommendation donut, a score-distribution chart, live progress that lights up node-by-node, and a one-click human-review panel.
Here’s what we’re building:
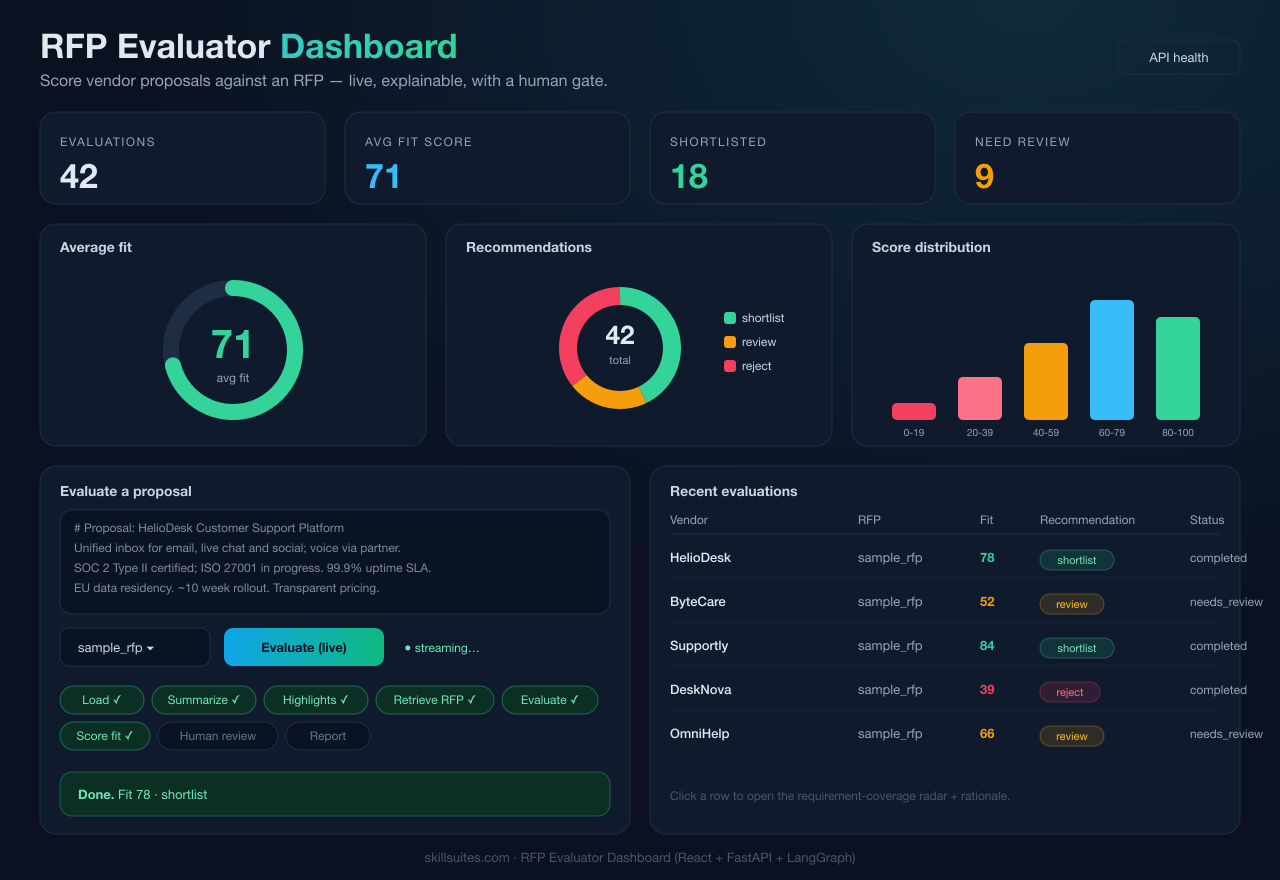
The stack is React + Vite + TypeScript + Tailwind CSS + Recharts — fast to build, easy to theme, and Recharts gives us production-quality charts with almost no boilerplate. Everything runs in Docker; docker compose up stands up the UI, the API, and Ollama together.

Step 1 — Scaffold the app
A Vite + React + TS project with Tailwind. The key Vite config is the dev proxy that forwards API and WebSocket calls to the FastAPI backend so you develop against the real engine:
// vite.config.ts
export default defineConfig({
  plugins: [react()],
  server: {
    proxy: {
      "/api": { target: "http://localhost:8000", changeOrigin: true, ws: true },
    },
  },
});
Tailwind is pointed at our sources and given a dark palette, and a small .card utility gives every panel the same glassy look:
/* index.css */
@tailwind base; @tailwind components; @tailwind utilities;

.card {
  @apply rounded-2xl border border-edge bg-panel/70 backdrop-blur p-5 shadow-lg;
}
Step 2 — A typed API client
One file holds the types and the fetch calls. Strong types here pay off across every component. (Angle brackets are TypeScript generics.)
export interface Evaluation {
  id: string; created_at: number; rfp_id: string; vendor?: string;
  fit_score?: number; recommendation?: "shortlist" | "reject" | "review";
  status: string; summary?: string; report_markdown?: string;
  assessments: Assessment[];
}

export interface Stats {
  total: number;
  by_recommendation: Record<"shortlist" | "reject" | "review", number>;
  avg_fit_score: number;
  score_buckets: Record<string, number>;
}

export const getStats = () => fetch("/api/stats").then(j<Stats>);
export const listEvaluations = () =>
  fetch("/api/evaluations").then(j<{ evaluations: Evaluation[] }>).then((d) => d.evaluations);
The WebSocket helper is tiny — open the socket, send the proposal, and forward each parsed event to a callback:
export function evaluateWS(text, rfp_id, onEvent) {
  const proto = location.protocol === "https:" ? "wss" : "ws";
  const ws = new WebSocket(`${proto}://${location.host}/api/ws/evaluate`);
  ws.onopen = () => ws.send(JSON.stringify({ text, rfp_id }));
  ws.onmessage = (m) => onEvent(JSON.parse(m.data));
  return ws;
}
Step 3 — The charts (this is the “wow”)
Recharts turns plain arrays into crisp SVG charts. Four components carry the visual weight.
Fit-score gauge — a radial bar with the number overlaid, colored by band (green/amber/red):
export function FitScoreGauge({ value, label }) {
  const color = value >= 70 ? "#34d399" : value >= 40 ? "#f59e0b" : "#f43f5e";
  return (
    <div className="relative h-44">
      <ResponsiveContainer>
        <RadialBarChart innerRadius="72%" outerRadius="100%"
          data={[{ value }]} startAngle={220} endAngle={-40}>
          <PolarAngleAxis type="number" domain={[0, 100]} tick={false} />
          <RadialBar dataKey="value" cornerRadius={14} fill={color} />
        </RadialBarChart>
      </ResponsiveContainer>
      <div className="absolute inset-0 flex flex-col items-center justify-center">
        <div className="text-4xl font-extrabold" style={{ color }}>{Math.round(value)}</div>
      </div>
    </div>
  );
}
Recommendation donut — a PieChart with an inner radius, one colored Cell per recommendation. Score distribution — a BarChart over the five score buckets. And the showpiece, the requirement-coverage radar, maps each requirement’s status to a value (met = 100, partially = 50, not met = 0) so a reviewer sees the shape of a proposal’s fit at a glance:
const STATUS_VALUE = { met: 100, partially_met: 50, not_met: 0 };

export function RequirementRadar({ assessments }) {
  const data = assessments.map((a) => ({ req: a.requirement_id, value: STATUS_VALUE[a.status] }));
  return (
    <ResponsiveContainer width="100%" height={280}>
      <RadarChart data={data}>
        <PolarGrid stroke="#1e2d44" />
        <PolarAngleAxis dataKey="req" tick={{ fill: "#94a3b8", fontSize: 10 }} />
        <Radar dataKey="value" stroke="#38bdf8" fill="#38bdf8" fillOpacity={0.35} />
      </RadarChart>
    </ResponsiveContainer>
  );
}
Step 4 — Live progress + the human gate
The proposal form is where the dashboard comes alive. Clicking “Evaluate (live)” opens the WebSocket and lights up each node chip as the engine streams progress; when the run ends it either shows the result or — for a borderline proposal — a shortlist/reject panel that resumes the engine.
const run = () => {
  setRunning(true); setDone([]);
  evaluateWS(text, rfp, (e) => {
    if (e.type === "progress" && e.node) setDone((d) => [...d, e.node]);
    else if (e.type === "completed") { setResult(e); setRunning(false); onDone(); }
    else if (e.type === "needs_review") { setReview(e); setRunning(false); onDone(); }
  });
};

const decide = async (decision) => {
  await submitDecision(review.id, decision, notes);   // resumes the graph
  setReview(null); onDone();
};
The progress chips are just a mapped list that recolors as nodes complete — simple, but it turns an opaque pipeline into something users watch:
{NODES.map((n) => (
  <span key={n} className={done.includes(n)
      ? "border-emerald-500/40 bg-emerald-500/15 text-emerald-300"
      : "border-edge text-slate-500"}>
    {LABELS[n]}{done.includes(n) ? " ✓" : ""}
  </span>
))}
Step 5 — History table + detail drawer
The evaluations table lists recent runs with a color-coded fit score and a recommendation badge; clicking a row opens a drawer with the requirement radar and each assessment’s rationale. The badge colors (emerald / amber / rose) are the same language as the gauge and donut, so the whole dashboard reads consistently at a glance.
{evaluations.map((e) => (
  <tr key={e.id} onClick={() => onSelect(e.id)} className="cursor-pointer hover:bg-white/5">
    <td>{e.vendor}</td>
    <td style={{ color: scoreColor(e.fit_score) }}>{e.fit_score}</td>
    <td><span className={REC_BADGE[e.recommendation]}>{e.recommendation}</span></td>
  </tr>
))}
Step 6 — The app shell
The App component loads stats and history on mount, refreshes after each run, and lays out the header, the four stat cards, the charts row, and the form + table grid. A single refresh() keeps every chart in sync:
const refresh = useCallback(async () => {
  const [s, e] = await Promise.all([getStats(), listEvaluations()]);
  setStats(s); setEvals(e);
}, []);

useEffect(() => { refresh(); getRfps().then(setRfps); }, [refresh]);
Step 7 — Dockerize the UI
A multi-stage build compiles the React app, then serves the static bundle with nginx — which also proxies /api (REST and WebSocket) to the backend, so the browser only ever talks to one origin:
# web/Dockerfile
FROM node:20-alpine AS build
WORKDIR /app
COPY package.json ./
RUN npm install
COPY . .
RUN npm run build

FROM nginx:alpine
COPY nginx.conf /etc/nginx/conf.d/default.conf
COPY --from=build /app/dist /usr/share/nginx/html
The nginx config is what makes the WebSocket work in production — the Upgrade/Connection headers turn a normal proxy into a WebSocket-capable one:
location /api/ {
  proxy_pass http://api:8000;
  proxy_http_version 1.1;
  proxy_set_header Host $host;
  proxy_set_header Upgrade $http_upgrade;
  proxy_set_header Connection "upgrade";
  proxy_read_timeout 600s;
}
Step 8 — Run the whole thing from scratch
One command brings up the UI, the API, and Ollama:
docker compose -f docker-compose.full.yml up -d --build

# pull the local models once:
docker compose -f docker-compose.full.yml exec ollama ollama pull llama3.1:8b
docker compose -f docker-compose.full.yml exec ollama ollama pull nomic-embed-text

# open the dashboard:
open http://localhost:8080
Paste a proposal, pick an RFP, hit Evaluate (live), and watch the chips light up as the engine runs — then the gauge, donut, and table update the instant it finishes. Borderline proposals surface a shortlist/reject panel right there.
Performance note
Recharts is feature-rich, so the production bundle is a few hundred KB gzipped. For a dashboard that’s fine, but if you care: lazy-load the charts with React.lazy, or split vendor chunks via Rollup’s manualChunks. Don’t prematurely optimize — ship it, then measure.
Troubleshooting & common errors
| Symptom | Cause | Fix |
|---|---|---|
| Charts render blank | No height on the container | Wrap charts in a fixed-height box / ResponsiveContainer with a height |
| API calls 404 in dev | Vite proxy missing | Add the /api proxy with ws: true (Step 1) |
| WebSocket fails in production | nginx not upgrading | Set Upgrade/Connection headers (Step 7) |
| CORS error in dev | Calling the API cross-origin | Use the Vite proxy, or the backend’s CORS middleware (Part 1) |
| Blank page after build | Wrong asset base path | Serve from root, or set Vite base to match |
Series wrap-up
Across seven articles we designed an RFP proposal evaluator, built it as an LLM-agnostic LangGraph engine that runs on Azure OpenAI, Vertex AI, or a self-hosted GPU, and then wrapped it in a production-shaped dashboard: a FastAPI backend with live streaming and a React frontend with charts that make the result obvious at a glance. The throughline never changed — design for the abstract interface, keep the decisions deterministic and auditable, put a human in the loop where it matters, and present it so clearly that the value is impossible to miss.
Frequently asked questions
Why Recharts over a heavier charting library?
Recharts is declarative React components over SVG — gauges, radars, pies, and bars with minimal code and easy theming. It’s more than enough for a dashboard and far lighter to integrate than a full charting framework.
How does the live progress actually work?
The browser opens a WebSocket to the backend, which streams the LangGraph engine node-by-node. Each progress event recolors a step chip; a final completed or needs_review event updates the charts and, if needed, shows the human-review panel.
Can I point the dashboard at Azure or Vertex instead of Ollama?
Yes — it’s the same LLM-agnostic engine. Change LLM_PROVIDER (and the provider’s env vars) on the api service; the dashboard doesn’t change at all.
Conclusion
We turned a capable-but-invisible AI engine into a dashboard people want to use: live, explainable, and visually obvious, with a human in the loop and a single docker compose up to run it all. That’s the difference between a demo and a product.
Independent educational project; not affiliated with any employer; not procurement or legal advice.
